Climate Graphs - Creative Society & Allatra IPM Science

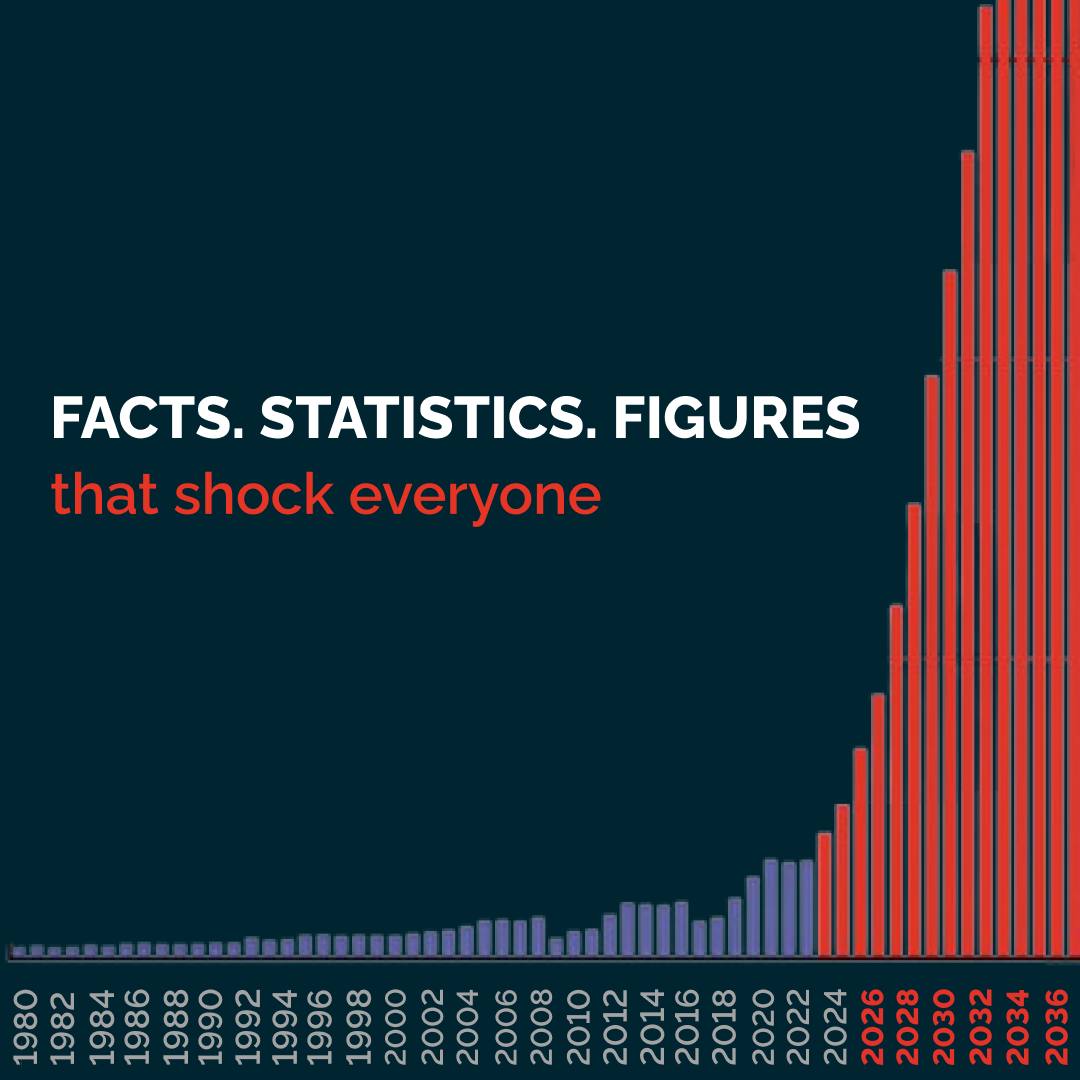
12000 Year Cycle - Data Graphs

Graph: progression of cataclysms 1980 to 2036

Graph: North Magnetic Pole - Velocity from 1900 to 2033

Graph: Rise in Average Temperatures Worldwide 1850 to 2023

Graph - NOAA Global Ocean heat content 1955 to 2019

Graph: Storms in United States - 9.5 times greater compared to period 1981 to 1990

Graph: Tornadoes in Europe - 18 times greater than 1970's

Graph: Floods worldwide six times greater than 1970s

Graph: Model Progression of Cataclysms - 1980 to 2036

Clear Dynamics of Climate Cataclysms


creative society logo

AMNESIA AIDE MEMOIRE

@ic_coates