BOM - WEATHER STATIONS - WESTERN AUSTRALIA
A few months ago, I decided to finally investigate Python, a computer language frequently used in Data Science and with the online help of 'Real Python' and recommendations to utilise; pandas, jupyter notebook and matplotlib, etc. I found myself downloading .csv files from BOM - Climate Online Data and then carefully working out how to construct a script to plot graphs of daily, monthly and mean highest temperature data.
These are some of the results. I started with the map of BOM Weather Stations above and honed in on 2 Automatic Weather Stations (AWS) located at Perth Airport and Perth Metro which are the closest to where I live.
I was aware that Onslow in Northern WA currently shares the Highest Recorded Temperature in Australia with Oodnadatta in South Australia. A breathtaking 50.7°C. I have always considered 40.0°C the benchmark of a 'hot' day. At this temperature, you can exit a building here in Perth and feel your eyeballs drying-out. I continue to marvel at the endurance of the Aboriginal nations in surviving the 'hot' seasons and necessarily timing their migrations to enjoy cooler breezes and sustain themselves with the bounty of our oceans. I'm also aware that inland neighbouring Marble Bar gets regularly mentioned when high temperatures are displayed on televised Weather News. So, I've included them below too.
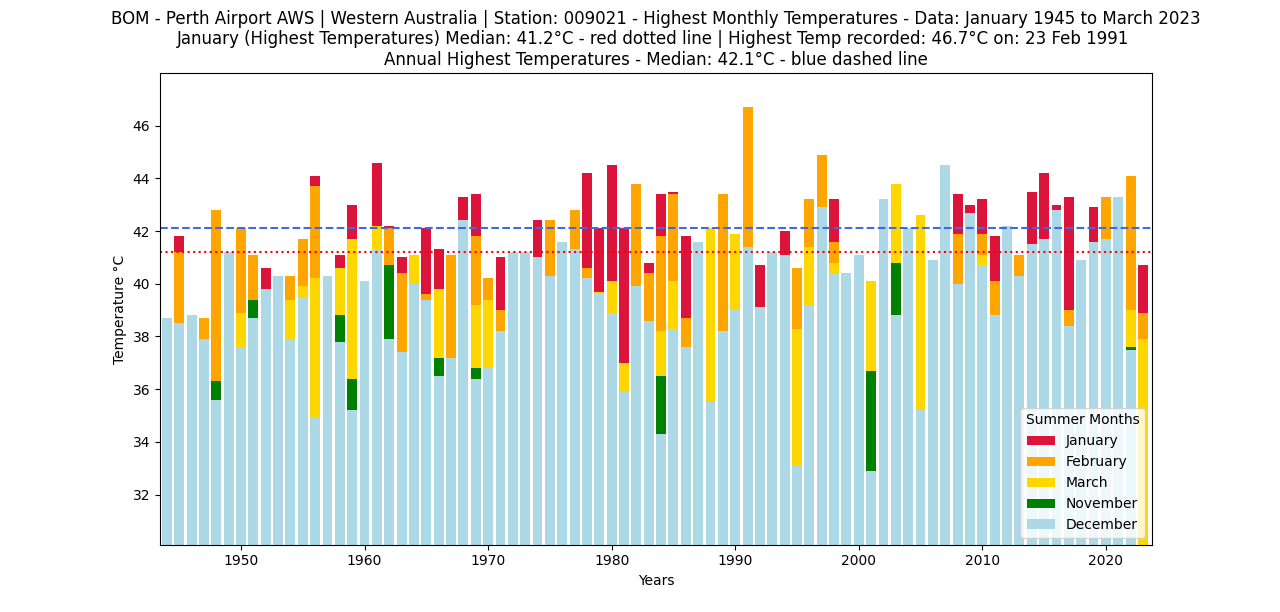

You may observe in the above graph that the low mean temperatures of the 1950's and 60's perceptibly start to rise in the 70's and have continued to rise. All below the median line temperatures are less than 9°C. Above the line many more months are 10, 11, and moving towards 12°C above the mean of 24.6°C. With our oceans warming this is likely to continue
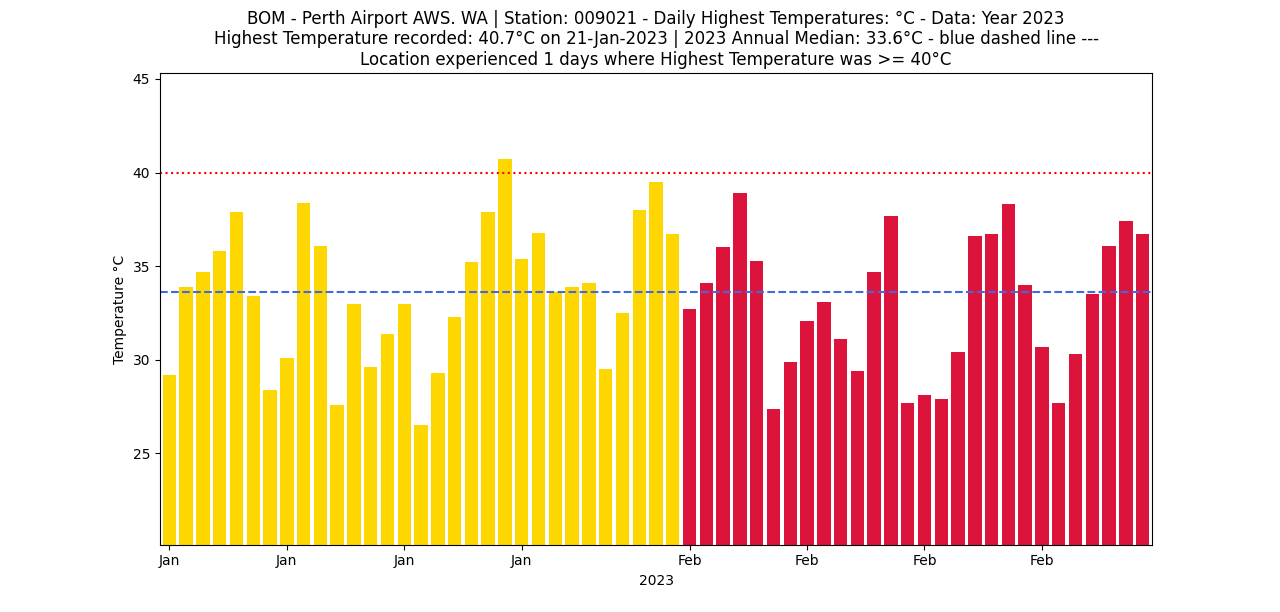
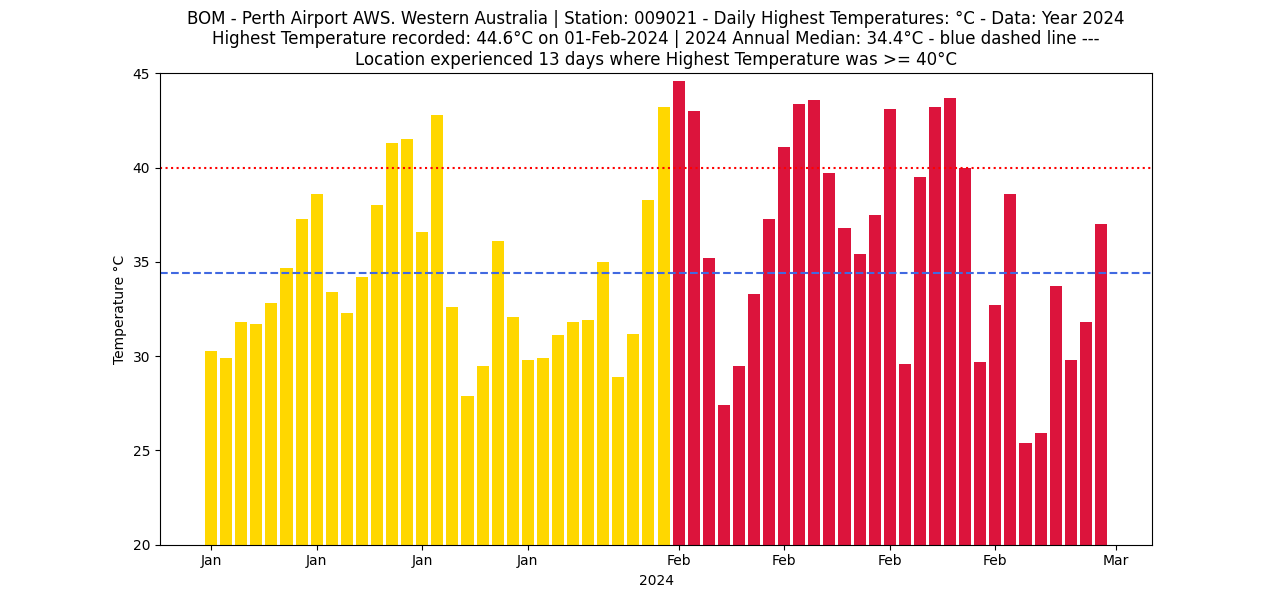
Now lets compare 2 graphs of BOM data from Perth Airport - Daily Highest Temperatures during the hottest summer months through January & February 2023 and 2024 NB. A hotter than anticipated start to 2024 - 13 days above >= 40°C as opposed to 1 day >= 40°C during the same period in 2023
 Now lets look at WA's BOM approved Highest Temperature recorded at Onslow
January - February 2023 - Highest Daily Temperatures - Perth Airport AWS
January - February 2024 - Highest Daily Temperatures - Perth Airport AWS
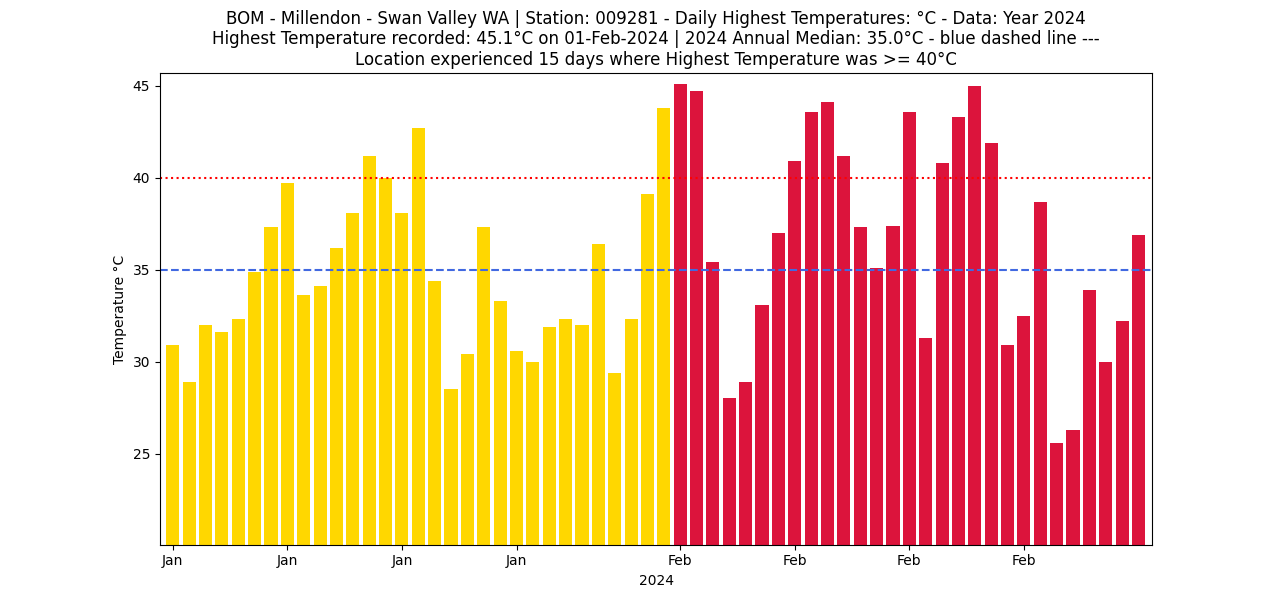
Since 2017 BOM introduced a new weather station at Millendon in the Swan Valley
This is now the nearest listed BOM Automatic Weather Station (AWS) to where I live. During January & February 2024, this recorded 2 further days (15 days total) >= 40°C and a new record temperature of 45.1°C on 1st February 2024 - You can observe the difference in the mean values too. I consider this significant and in line with future forecasts of so called 'Mega-Droughts' a daunting prospect for WA's wheat farmers, vineyards, vegetable and fruit growers and communities.
Now lets look at WA's BOM approved Highest Temperature recorded at Onslow

I'm anticipating that in line with record temperatures in other areas of the world that Onslow and Marble Bar (below) will likely reach new records either later this year or in the early months of 2024. We shall see. One can only hope that the hardy locals have air-conditioners which are fully functional or they have a temporary migration plan in place. I hope I'm wrong!
Fortunately in early 2024, the North & NE of WA at Onslow Airport and Marble Bar the temperatures were cooler during January & February 2024. Onslow reached 47.2°C while Marble Bar reached a high of 47.9°C. However, Carnarvon to the west of Onslow reached a new record 49.9°C on 18 February 2024 topping its previous high by 2°C. Interesting to establish how the El Nino reported by BOM effected this region of northern WA.


INVESTIGATING CLIMATE TRANSFORMATION - LINKS
BOM WEATHER STATIONS - AUSTRALIA - [ GOOGLE MY MAPS ]
BOM WEATHER STATIONS - WA - TOP